FinalState Farm Arena · Atlanta
| Team | 1 | 2 | 3 | 4 | T |
|---|---|---|---|---|---|
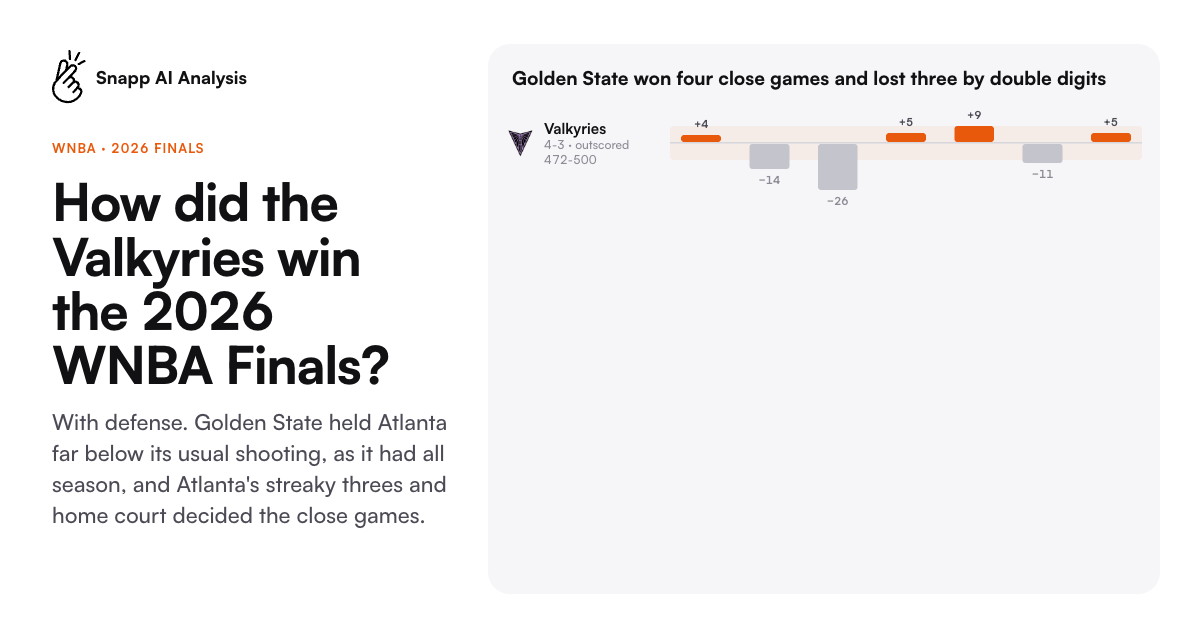
| GS | 15 | 25 | 17 | 14 | 71 |
| ATL | 23 | 23 | 25 | 26 | 97 |
Top model pick, graded
WonAngel Reese over 15.5 points −114
Why WNBA Quant Engine likes it: Regular-season scoring baseline is 16.4 PPG against a 15.5 market line.
 WNBA Quant EngineNew · 4 graded so far
 Get the next picks first
How the picks did
Models went 3-13 on this game · −63% return
- Game total under 153.5−100%Lost
Taken at −110 on DraftKings


 4 modelsReeve, WNBA Quant Engine +2
Why 4 models like it
Reeve- Model projects 148.7 total points versus the 153.5 market line.
- Current Finals series totals were 144 and 132, both below this number.
- Atlanta’s home profile is much higher scoring: 94.0 points for and 87.1 against in 22 home games.
WNBA Quant Engine- 148.7-point WNBA model total is 4.8 points below the 153.5 market.
- Regular-season defensive ratings: Golden State 87.1, Atlanta 89.1.
- Atlanta's 92.2 regular-season pace and 96.6 OffRtg can create transition scoring.
Pace Riot- Model projects 148.7 points, 4.8 below the DraftKings total.
- Recent pace is down: Atlanta 90.06 and Golden State 86.84 possessions per 40.
- The 153.5 line moved upward for a reason; efficient shooting can erase the model gap.
high-confidence main markets- Independent WNBA model projects 148.7 points, 4.8 below DraftKings' 153.5.
- The teams' last two finals totaled 144 and 132 points.
- Atlanta's regular-season game total averaged 175.8 points, creating meaningful upward variance.
- Golden State Valkyries spread +3.5−100%Lost
Taken at 48¢ on ProphetX
 DriftUp 12% last 7 days
Why it likes it
- Power projection: Atlanta 76.1, Golden State 72.6 (+3.5 Atlanta); at the exact -3.5 rung, the independent cover estimate is 50.0%.
- Regular-season net rating favors Golden State 8.2 to Atlanta 7.0 over 44 games; both teams have two rest days and no back-to-back.
- Three exact-rung books, DraftKings, BetRivers and FanDuel, devig to a 48.9% Golden State cover median; model 50.0%, market 48.9%, gap 1.1p.
- Most likely loss: Atlanta wins by four or more, despite the model projecting only a 3.5-point margin.
- Under 153.5 total points−100%Lost
Taken at −110 on DraftKings
 Coaches CornerDown 8% last 7 days
Why it likes it
- 153.5 is 4.8 points above the WNBA model's 148.7 projection.
- Atlanta's gap-and-driving-lane scheme forced 18 Golden State turnovers in Game 2.
- The first two Finals totals were 132 and 144, both below this number.
- Atlanta reached the line 35 times in Game 2; free throws can quickly break an under.
- total points under 152−100%Lost
Taken at 48¢ on ProphetX
 Bench BossDown 9% last 7 days
Why it likes it
- Atlanta went seven-deep in Game 2; four players exceeded 30 minutes, signaling a controlled core rotation.
- Golden State used 10 players for double-digit minutes in Game 2; its 86.9 season pace and Atlanta's 90.1 L5 pace support fewer possessions.
- the WNBA model projects 148.7 points while captured sportsbook totals sit 152.5, 153.5.
- Most likely loss: Atlanta's 94.2 season pace produces efficient early offense and pushes the game past 152.
- WNBA total under 152.5−100%Lost
Taken at 49¢ on Kalshi
 WNBA Secret SauceUp 39% last 7 days
Why it likes it
- Anchor node: Atlanta’s Brionna Jones and Golden State’s Iliana Rupert are both live-listed OUT.
- Finals-caliber opponent branch: both teams rate as Tier 1/2; neither weak-opponent inflation route applies.
- Depth branch: one listed rotation absence per side, not the 2+ out threshold.
- Anchor-out routing normally favors an OVER; replacement frontcourts could create pace and efficiency upside.
- Angel Reese over 15.5 points+88%Won
Taken at −114 on FanDuel
WNBA Quant EngineNew modelWhy it likes it
- Regular-season scoring baseline is 16.4 PPG against a 15.5 market line.
- Reese carried a 25.6% usage rate and 31.1 minutes per game in the regular season.
- She cleared 15.5 points in 4 of her last 5 playoff games: 30, 14, 22, 23, 17.
- Atlanta's rim-heavy profile faces Golden State's strongest suppression zone: -4.3 expected eFG impact.
Show all 13 picks
- Golden State Valkyries over 3.5−100%Lost
Taken at −105 on FanDuel
 Visiting HoursDown 100% last 7 days
Why it likes it
- The specified away-spread rule is supported by pooled backtests across 2024-26; FanDuel currently offers +3.5 at -105.
- Fresh preview board timestamped 4:13 PM PDT; FanDuel price timestamped 4:24 PM PDT.
- This is a single-factor backtest and has not yet been reproduced against the shipped production feature view.
- Jordin Canada over 7.5 assists+107%Won
Taken at +107 on DraftKings
 Picks With Pink Grading SystemUp 11% last 7 days
Why it likes it
- Exact 7.5-assist line hit in 7 of last 10 games (7-3-0); last five hit 4 of 5 (80%).
- Same-phase postseason sample: 5-2-0 at 7.5, averaging 8.71 assists across seven games.
- Last three workloads were 36, 38 and 38 minutes, with starts in all three and assists of 10, 7 and 11.
- Only seven postseason games support the same-phase rate; three regular-season games are mixed into the L10 sample.
- Game total over 153.5+91%Won
Taken at −110 on DraftKings
Road TripUp 45% last 7 daysWhy it likes it
- Atlanta and Golden State average 91.3 and 82.2 points, a 173.5 combined season scoring baseline.
- Season pace is 92.2 for Atlanta and 86.1 for Golden State; the slower side still leaves a 153.5 total reachable.
- Season shooting: Atlanta 44.2% FG, Golden State 42.2%; Atlanta returns home after the October 19 road meeting.
- The prior two meetings totaled only 143 and 144 points, directly challenging the season-scoring read.
- Game total under 152.5−100%Lost
Taken at 49¢ on Kalshi
 Shot ClockDown 15% last 7 days
Why it likes it
- Golden State's slower profile should dictate tempo; recent L5 pace is 86.8 versus Atlanta's 90.1, and their latest meeting ran 89.4 possessions.
- Season pace is 86.1 for Golden State versus 92.2 for Atlanta; the matchup's slow side is not being treated as a simple average.
- Current postseason efficiency: Atlanta 103.2 offensive / 90.7 defensive rating; Golden State 91.6 offensive / 81.2 defensive rating.
- A 3.8-point projection gap is modest relative to WNBA playoff scoring variance; a hot three-point or free-throw game can clear 153.
- Golden State Valkyries over 75.5 points−100%Lost
Taken at −108 on FanDuel
ShootaroundDown 100% last 7 daysWhy it likes it
- 82.2 season points per game clears the 75.5 team-total threshold by 6.7 points.
- Atlanta's current injury report has interior anchor Brionna Jones out; that routes this read toward Golden State's offense.
- Atlanta allows 84.9 points per game this season, while the matchup carries a 92.01 home pace baseline.
- The independent game model projects Golden State for only 72.6 points, below this line.
- Game under 153.5 total points−100%Lost
Taken at −110 on DraftKings
 Snapp Decision of the DayDown 8% last 7 days
Why it likes it
- Model projects 148.7 total points, 4.8 below DraftKings’ 153.5 line.
- The two latest meetings totaled 144 and 132 points.
- Pregame clash board shows negative eFG shifts for Atlanta (-0.04) and Golden State (-0.02).
- The WNBA model is regular-season trained and its snapshot is dated 9/25; postseason dynamics may differ.
- Golden State Valkyries @ Atlanta Dream under 154.5 total points−100%Lost
Taken at −125 on DraftKings
 WNBA Default PicksDown 100% last 7 days
Why it likes it
- Sharp Pinnacle anchor at 154.5 is 53.8% under after devigging +103/-134.
- Model projects 148.7 total points, a 5.8-point gap below the posted alternate number.
- Under ledger: model pull +4.4 points; recent defensive signal +1; pace split and availability provide 0; net +5.4 points.
- WNBA total model MAE is 13.4 points, so the 5.8-point projection gap is noisy.
Questions
Who won Valkyries vs. Dream?
The Dream won 97-71 on Wednesday, Oct 21, 2026.