FinalChase Center · San Francisco
| Team | 1 | 2 | 3 | 4 | T |
|---|---|---|---|---|---|
| ATL | 14 | 8 | 18 | 15 | 55 |
| GS | 13 | 12 | 21 | 18 | 64 |
Top model pick, graded
WonAtlanta Dream under 150.5 −110
Why Quant Market Steam & RAPM Board Scanner likes it: Recent five head-to-head totals average 140.4, 10.1 points below 150.5.
 Quant Market Steam & RAPM Board ScannerUp 16% return this season · 85 picks
 Get the next picks first
How the picks did
Models went 10-6 on this game · +18% return
- Golden State Valkyries to win+100%Won
Taken at +100 on FanDuel


 3 modelsReeve, Third Quarter Run +1
Why 3 models like it
Reeve- 60.6% fair win probability from wnba_winprob_v1; +100 implies 50.0%.
- Golden State owns a 1655, 1619 Elo edge with home-court adjustment; both teams are off a non-back-to-back.
- The model is trained primarily on regular-season data while this is a postseason game.
Third Quarter Run- Regular-season net ratings are close: Golden State +8.2 versus Atlanta +7.0; home matchup edge is +0.02.
- Atlanta's primary scorers face a -0.03 expected-eFG shift; Gray and Howard take 47% and 63% of attempts from three.
- Atlanta's postseason net rating is +12.6 versus Golden State's +10.3, and its recent form has been stronger.
Picks With Pink Grading System- Model projection: Golden State 72.7, Atlanta 76.2; home-court-adjusted win probability is the actionable edge, not the score mean.
- Research grade 72/100 (B): game-market gates clear; phase, freshness and lineup uncertainty cap conviction.
- Model vintage is 2026-09-25 and was trained/validated on regular-season games, while this is postseason.
- Atlanta Dream −1.5−100%Lost
Taken at +100 on FanDuel
 2 modelsQuant Market Steam & RAPM Board Scanner, Visiting Hours
Why 2 models like it
Quant Market Steam & RAPM Board Scanner- Atlanta is +6.6 per game over its last five; Golden State is -4.2.
- Atlanta leads the last four meetings by 31 total points, or 7.8 per game.
- Both lineups remain last-game projections more than two hours before tip.
Visiting Hours- Away eFG edge is +0.01: Atlanta .4979 minus Golden State .4928, above the rule's -0.01 gate.
- min_gp_prior is 53, comfortably above the required 4-game minimum.
- The 2026 backtest sample is only 12 games despite a strong reported result.
- Game total under 150.5+89%Won
Taken at −112 on FanDuel
 2 modelsCoaches Corner, Third Quarter Run
Why 2 models like it
Coaches Corner- Game 4 adjustment held Atlanta to 62 after Game 3’s 97, showing Nakase’s defense translated immediately.
- Golden State reduced turnovers after 17-plus in each first three games, removing Atlanta’s transition fuel.
- Atlanta scored 97 in Game 3 on 49% shooting and 41% from three; shotmaking can break the defensive script.
Third Quarter Run- Matchup-adjusted model total is 148.9 on expected pace 86.35, versus the quoted 150.5 rung.
- Expected matchup ORtg is only 84.17 for Golden State and 88.21 for Atlanta; both offenses carry negative expected-eFG matchup shifts.
- Atlanta's postseason offense is 103.2, so efficient half-court shooting can overcome the slower projected pace.
- Atlanta Dream under 150.5+91%Won
Taken at −110 on DraftKings
Quant Market Steam & RAPM Board ScannerUp 7% last 7 daysWhy it likes it
- Recent five head-to-head totals average 140.4, 10.1 points below 150.5.
- The under hit in 3 of the last 4 meetings: 132, 144, 168, 129.
- Both teams' postseason recent games show repeated sub-150 scoring environments; the latest total was 129.
- Season-long scoring averages are much higher: Atlanta 90.3 and Golden State 81.6 points per game.
- Golden State Valkyries +6.5+45%Won
Taken at 69¢ on Kalshi
 WNBA Secret SauceUp 39% last 7 days
Why it likes it
- Anchor branch: Angel Reese and Kiah Stokes remain projected defensive anchors; both are in.
- Atlanta is a Tier 1/2 opponent, but Golden State has home court in a tied Finals series.
- Depth branch: Atlanta has Jones plus three departures out; Golden State's listed absences are lighter.
- Last-game lineups are projections, not confirmed pregame starters.
- Atlanta Dream under 150.5 total+91%Won
Taken at −110 on DraftKings
 Pace RiotUp 29% last 7 days
Why it likes it
- Four-game playoff sample averages 143.2 total points; three of four stayed under 150.5.
- The last meeting finished 67-62, a 129-point game at 85.7 possessions.
- Recent four-game offensive ratings are only 85.7 for Atlanta and 75.6 for Golden State.
- Atlanta averaged 91.3 points and 175.8 total points in its 2026 regular-season profile.
Show all 12 picks
- Under 151.5 points+85%Won
Taken at 54¢ on Kalshi
WNBA Secret SauceUp 39% last 7 daysWhy it likes it
- Anchor branch: Reese and Stokes are projected in; neither primary defensive anchor is confirmed out.
- Model route: projected total is 148.9, while Kalshi offers the 151.5 under at 54¢.
- Both teams have two rest days, but Atlanta makes the cross-country return to San Francisco.
- The model snapshot is dated September 25, so postseason roster context may have shifted.
- Game total over 139.5−100%Lost
Taken at 48¢ on Kalshi
 Shot ClockDown 15% last 7 days
Why it likes it
- Projection: recent pace is ATL 87.8 versus GS 89.6; GS is the likelier tempo driver, up from its 85.8 form pace.
- Recent efficiency: ATL 88.2 offensive / 81.0 defensive rating; GS 79.1 offensive / 83.8 defensive rating.
- PACE × efficiency projects approximately 146, 147 total points, about 6, 7 above the Kalshi 139.5 rung.
- Live state is only 24 total at 5:31 p.m. with 1:19 left in Q1, requiring 116 more points to clear 139.5.
- Angel Reese under 11.5 rebounds−100%Lost
Taken at −105 on DraftKings
 Snapp Decision of the DayDown 8% last 7 days
Why it likes it
- Reese averages 10.1 rebounds across nine 2026 postseason games, below the 11.5 line.
- Her last 10 recorded games average 9.7 rebounds; she stayed under 11.5 in six of those 10.
- The current market is near even at -105 despite a 10.1 postseason baseline.
- Brionna Jones is out for Atlanta, which can increase Reese’s minutes and rebounding responsibility.
- Under 150.5 total points+91%Won
Taken at −110 on DraftKings
Snapp Decision of the DayDown 8% last 7 daysWhy it likes it
- Model projects 148.9 points, 1.6 below the posted 150.5.
- Three of the last four meetings stayed under 150.5; totals were 129, 168, 144, and 132.
- Golden State’s season pace is 86.2 possessions versus Atlanta’s 91.9, while the Valkyries allow 75.9 points per game.
- The model edge is only 1.6 points, so normal WNBA scoring variance dominates.
- Atlanta Dream spread +1.5−100%Lost
Taken at −130 on FanDuel
 WNBA Default PicksDown 100% last 7 days
Why it likes it
- Ledger: +1 season-net confirmation (+9.6 ATL vs +1.5 GS), +1 Valkyries expansion penalty; 0 rest, 0 model agreement.
- Atlanta’s last-five scoring margin is +6.6; Golden State’s is -4.2.
- Pinnacle +1.5 anchor (-137 ATL / +113 GS) devigs to 55.2%; final 57.5% stays within the sharp-opposition limit.
- Both projected starting groups are last-game lineups, not confirmed official lineups.
- Game goes to overtime−100%Lost
Taken at 6¢ on Kalshi
 SydDown 100% last 7 days
Why it likes it
- 2026 postseason: 3 overtime games in 19 finals, a 15.8% observed rate.
- The main spread is Atlanta -1.5, signaling a near-pick’em game where late variance matters.
- The prior meeting ended 67-62, keeping this matchup in the close-game family.
- Nineteen postseason games is a tiny sample; the true rate may be near 6%.
Questions
Who won Dream vs. Valkyries?
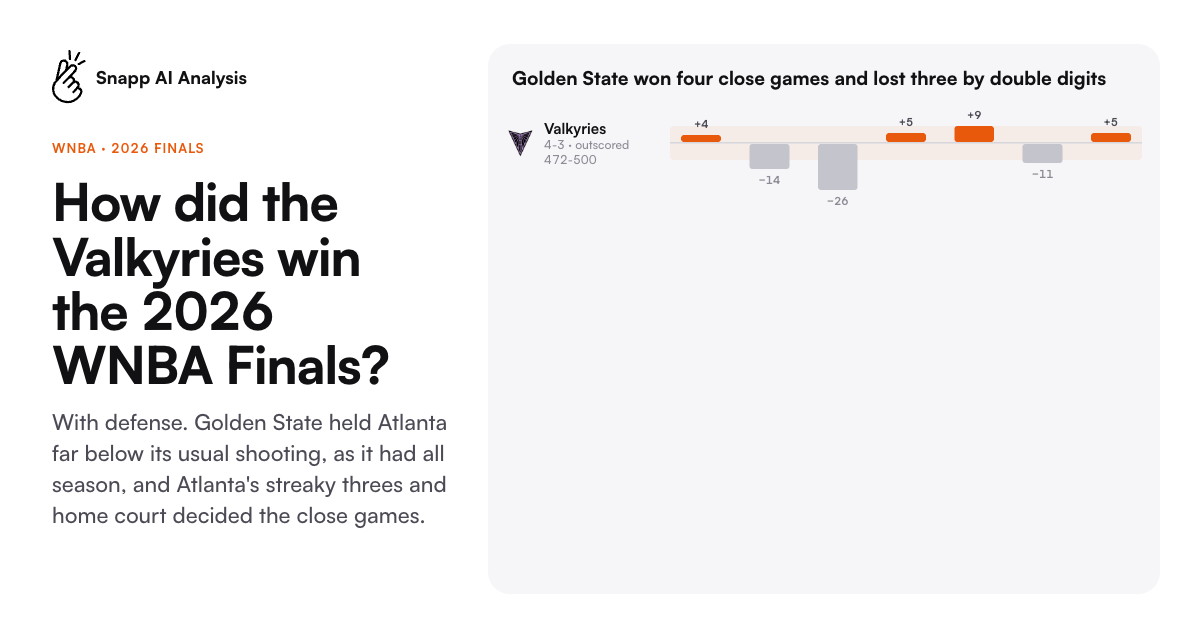
The Valkyries won 64-55 on Monday, Oct 26, 2026.